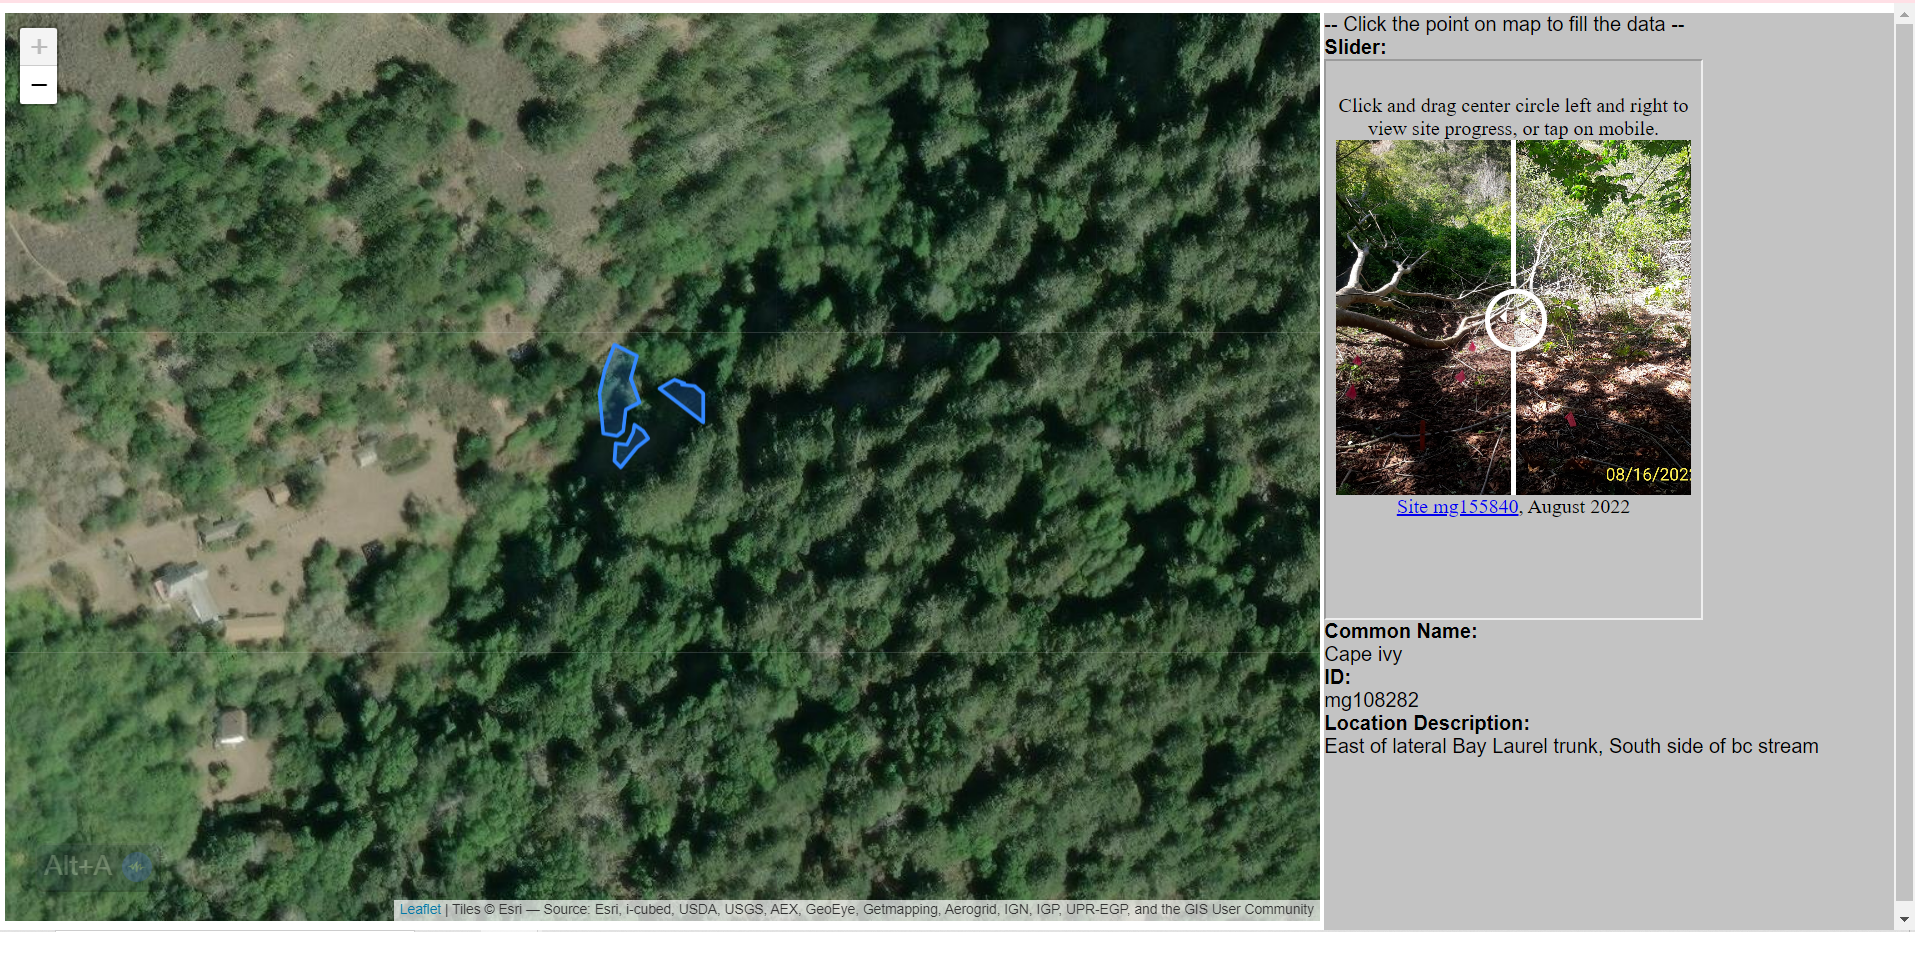
Workday Map
A map displaying habitat restoration worksites, with before/after image sliders demonstrating progress. A Javascript/HTML project using Leaflet Github
Geography, invasive species ecology, GIS, webmapping, Python

Creating maps and web tools for ecology and conservation.

A map displaying habitat restoration worksites, with before/after image sliders demonstrating progress. A Javascript/HTML project using Leaflet Github
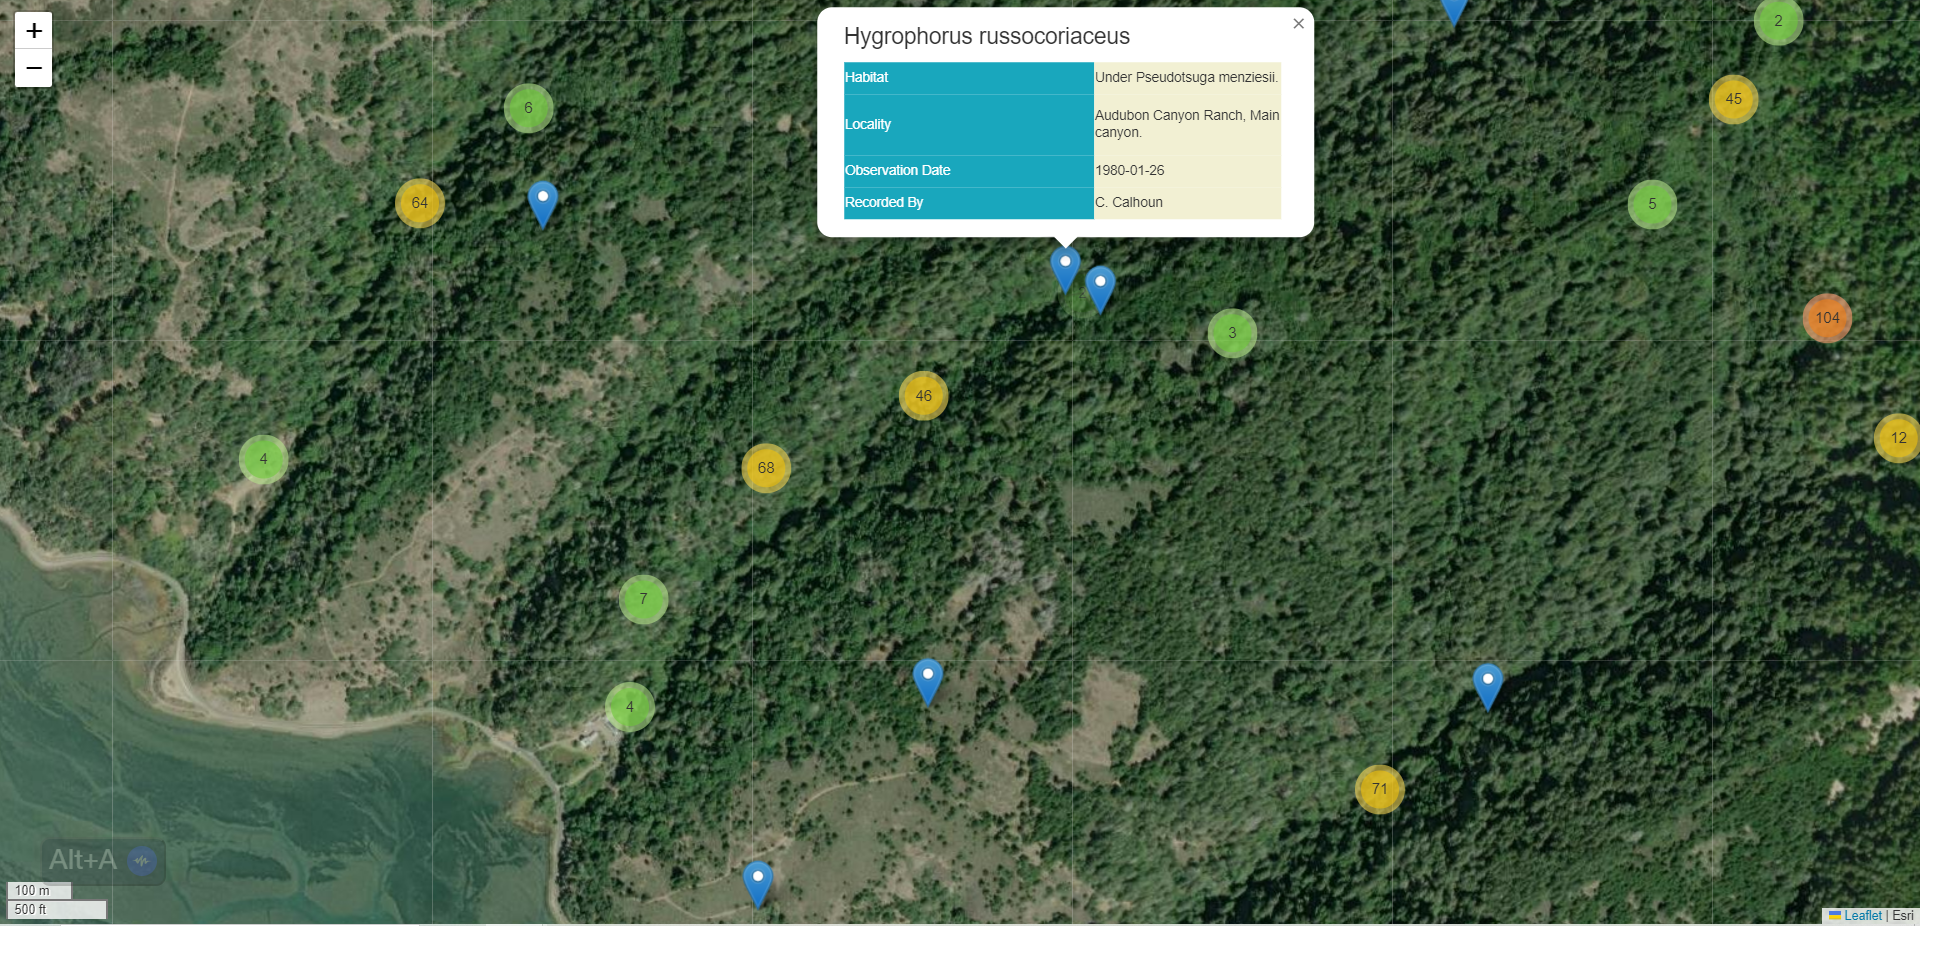
This dataset listing Fungarium Specimens was downloaded from a MycoPortal search. I wanted to create this because the MycoPortal platform provides collection location coordinates but does not provide a map. This map displays data from a particular 1980s mycological survey.
Built using Folium (Leaflet in Python), MarkerCluster plugin for Folium, Branca for Folium, DwCAReader. This program creates an HTML/Javascript map for a static web page. Github
Python coding project to create a search schedule for invasive plants. The schedule takes into account the phenology, visibility data from an NPS study, and creates a list for each habitat based on the time of year. The invasive species plant data source and the local Vegetation Map use different plant community naming systems, so I had to convert between the two taxonomical systems. I used the Jepson Plant Community guide to ensure the conversions were accurate. The table also subdivides these species searchlists by their potential threat of invasiveness in particular habitats.
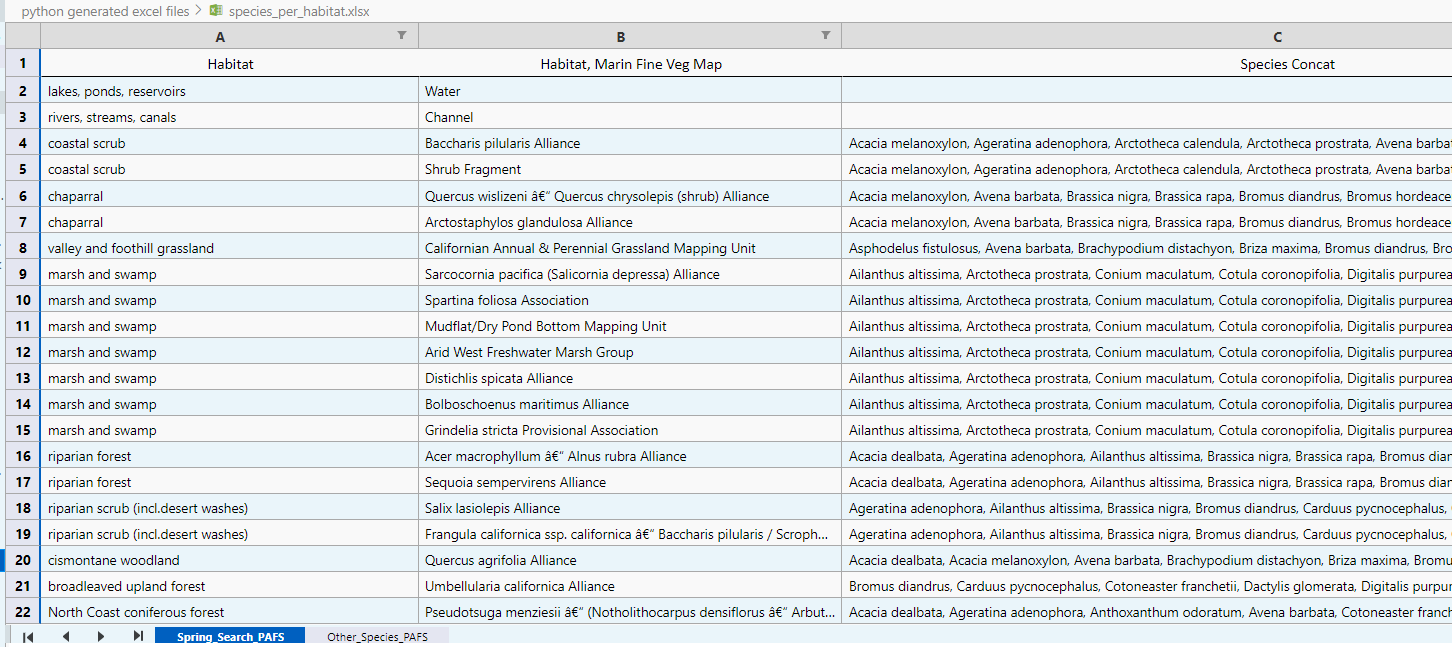
This search schedule is location based - it only creates lists for habitats within a given polygon. Using the park boundary and a local vegetation map, I did a spatial clip in ArcGIS to find all the habitats inside the nature preserve. Next, I found all unique habitat names using a Python script.
import json
import pandas

# Load the GeoJSON file
with open('GIS data\mgp_veg_clip.geojson') as f:
    data = json.load(f)

# Extract unique values of "MAP_CLASS_18" property
unique_values = set(feature['properties']['MAP_CLASS_18'] for feature in data['features'])

# Print unique values with one value per line
for value in unique_values:
    print(value)

    # Convert unique values to a DataFrame
df = pd.DataFrame(unique_values, columns=['Unique Values'])

# Export DataFrame to Excel
df.to_excel('unique_values.xlsx', index=False)
The searchlist is further improved by focusing on only the most credible threats based on their invasiveness ranking and capacity to cause novel infestations.
A focused list of only the most urgent threats is a useful tool to give to field workers who are not botanical experts. More eyes on invasive plants helps prevent big problems before they get started. A targeted list is made for impact. Field workers can learn a handful of the most credible and concerning invasive species threats.
I built the database for this project using MS Access, and retrieved the data using SQL. When building some of the more complex SQL queries, I imported tables into PostgreSQL. Here is a document I wrote that outlines my SQL pipeline for this project.
A Python-based project using Pandas, matplotlib, numpy, Shapely, BeautifulSoup Github
I like to take photos of habitat restoration workdays so we can celebrate how much work got done! This tool made it easy to share the photos with volunteers.

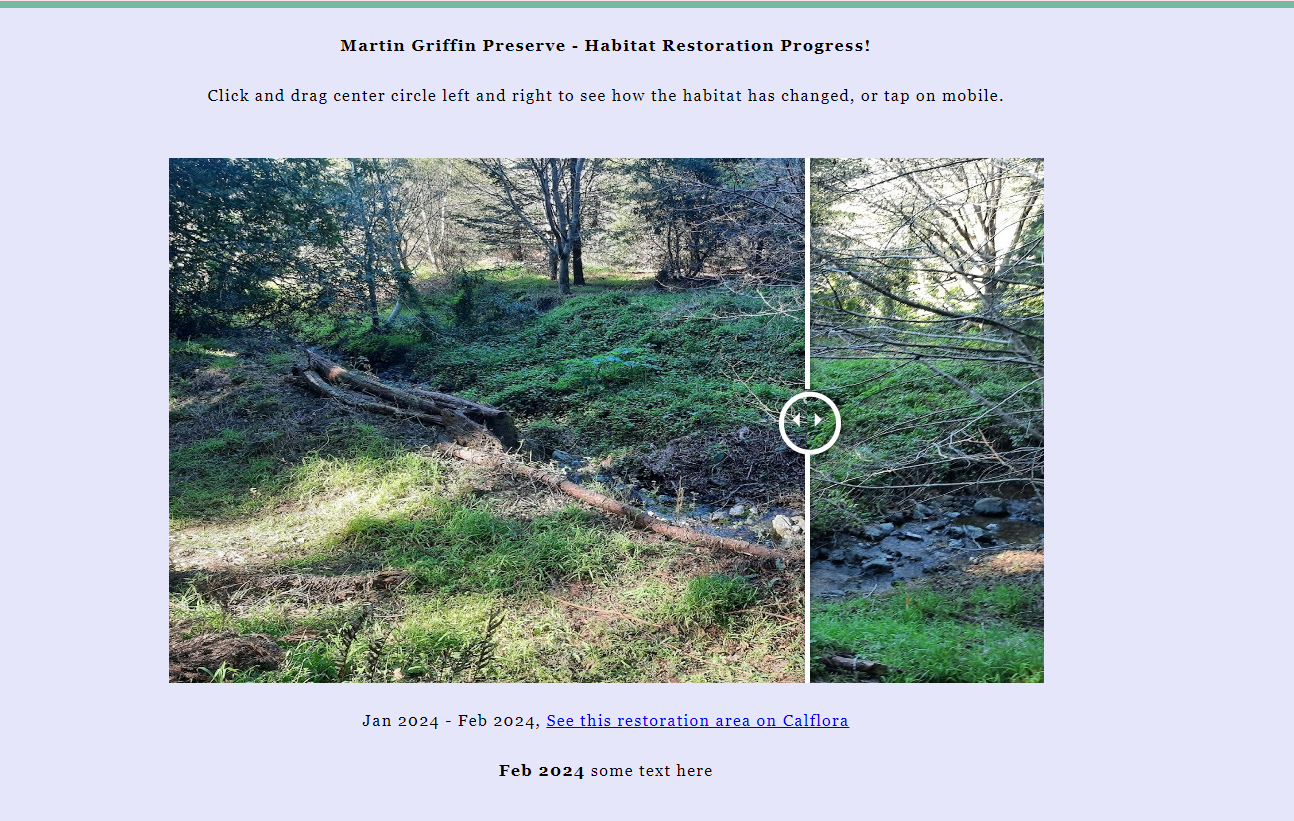
I created a Python-based program that creates displayable before-and-after sliding widgets for workday progress photos. The program resizes images to fit the slider, and replaces text and links where appropriate. The user selects images and enters relevant data with a simple GUI interface, and gets an output folder to host on a static HTML website.
This project was built in Python using PyInstaller, BeautifulSoup, PySimpleGUI, PIL, RegEx Github
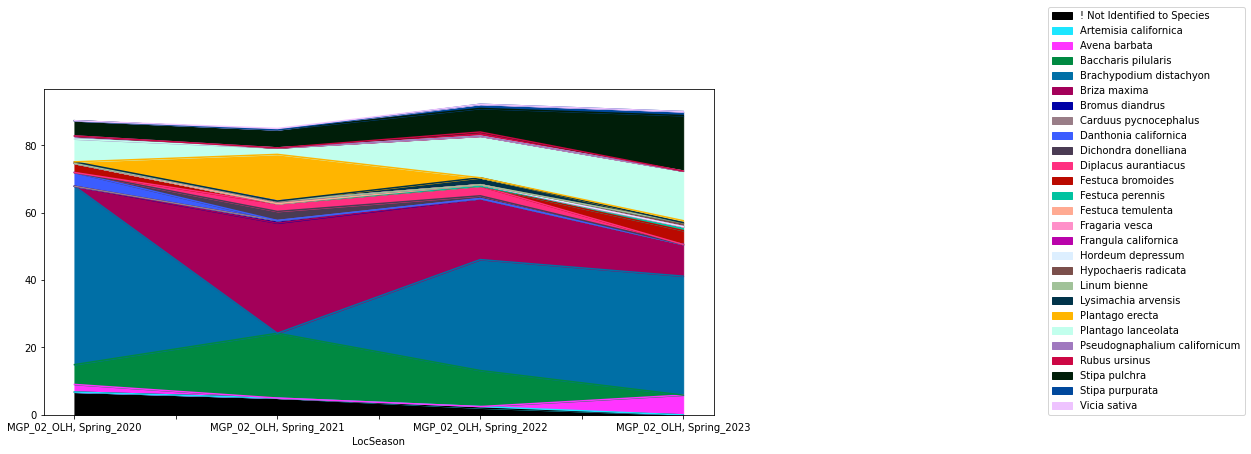
To summarize four years of botanical surveys in grasslands, I created charts in Python using matplotlib, Pandas, numpy Github
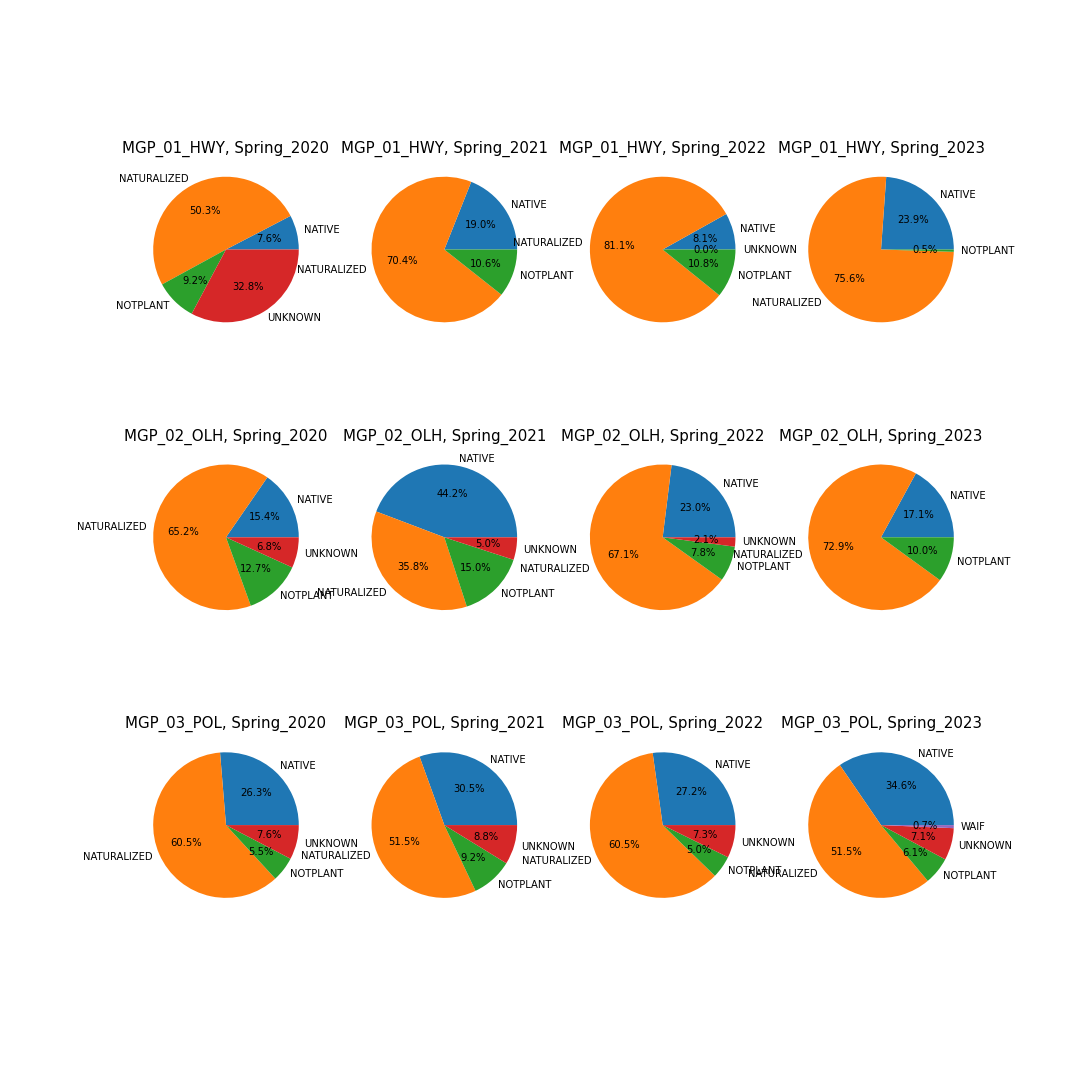
These charts compare nativity on three sites over a timespan of three years, and shows the change in proportional presence of individual species.
